The Carbon Footprint
The carbon footprint refers to the direct and indirect production of greenhouse gasses by an organization, individual, service, or product. Typically carbon footprints are reported in terms of CO2 equivalents.
Greenhouse gases are emitted in the use of most energy sources, (read more about carbon, energy, and climate here) Thus the carbon footprint is closely associated with energy consumption. Typically transportation, food production and consumption, fuel use, land use, and consumption of manufactured goods are key factors in carbon footprint estimates. The importance of the carbon footprint transcends energy conservation due to the effect it has on the the carbon cycle, ocean acidification, and anthropogenic climate change.
Tracking Carbon
On a practical level, the carbon footprint allows individuals and organizations to take stock of their energy usage and carbon impact. Without carbon accounting much of the energy we consume is hidden in the products and services we use. The carbon footprint takes into account carbon emissions from all the various transportation modalities you use as well as the various other ways you use energy both directly and indirectly.
As shown in the graph below, humanity's global carbon footprint has been steadily rising for decades and consequently so as has atmospheric CO2 levels (use the graph selection option to view atmospheric CO2 ).
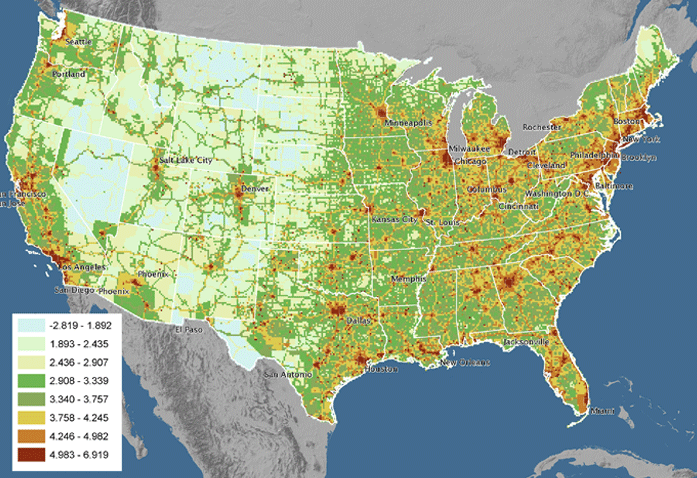
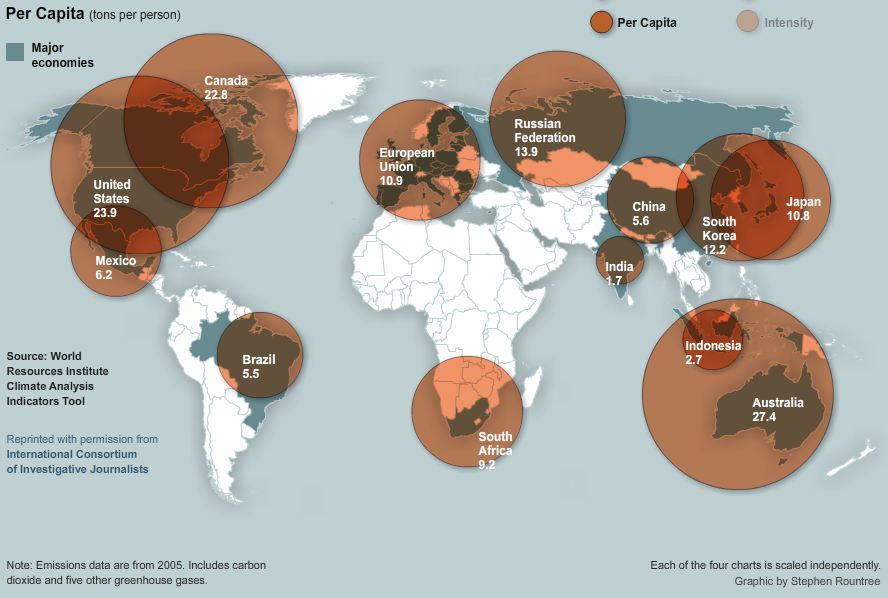
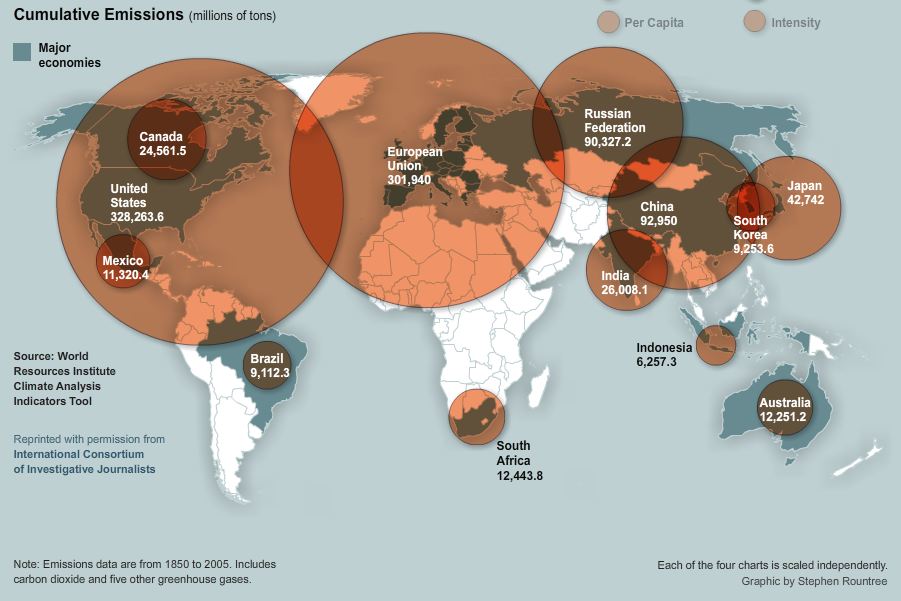
National Carbon Footprint Computing the Carbon footprint on a national level is an important aspect of the carbon footprint estimate for people and organizations. The energy infrastructure of each country is unique. The details of national energy and environmental policy play an important role in how energy efficient and carbon intensive products and services are within that nation. The world maps below reflect various estimates of the carbon footprint of different countries. Use the map selection option to view different maps Each map is linked to it's original interactive version, view these to learn more about the methods behind and implications of these maps.
Energy Sources
Vulcan Project scientists describe how CO2 emissions over the US are mapped.
Carbon Footprints!
Human impact and environmental resource accounting tools are often referred to as ecological footprints. Footprint calculators allow you to estimate your consumption of resources such as water or land as well as your production of wastes such as CO2.
These online calculators can help individuals and organizations find important ways improve the efficiency of their use of environmental resources.
National geo Ed resource
National geo food comparison calc
foot pring map 1960-2050
Ecological_Footprint_Atlas_2010
Human Footprint Maps
Human Footprint Nasa 2
The Human Footprint National Journal
Human Footprint Nasa
Human Footprint Nasa 3
Human Footprint Nasa 5
Human Footprint Nasa 4
Human Footprint Nasa 4
Best Foot fwd Ecological footprint for UK
Eco Foot print calculator
Ecology FUnd Eco calculator for EU, US, and AUS
Sustainable Scale Project
Water footprint diagrams
crops
http://environment.nationalgeographic.com/environment/freshwater/global-water-footprint/
wf of nations
http://wwf.panda.org/about_our_earth/all_publications/living_planet_report/living_planet_report_graphics/water_footprint_interactive/
footprint graphics
http://www.waterfootprint.org/?page=files/InfoGraphics
http://www.waterfootprint.org/downloads/2009-GOODTransparancy.jpg
http://www.waterfootprint.org/downloads/2012-TheGuardian-VirtualWaterFlows.gif
http://www.waterfootprint.org/downloads/Poster-A3-WaterFootprint-of-Products.pdf
http://www.waterfootprint.org/downloads/2011-TNC-WaterFootprintPoster.jpg