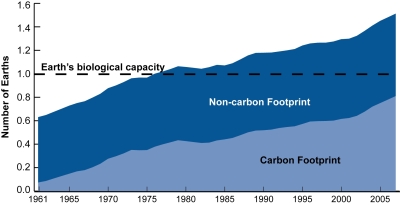
Click to view source page at the Global Footprint Network
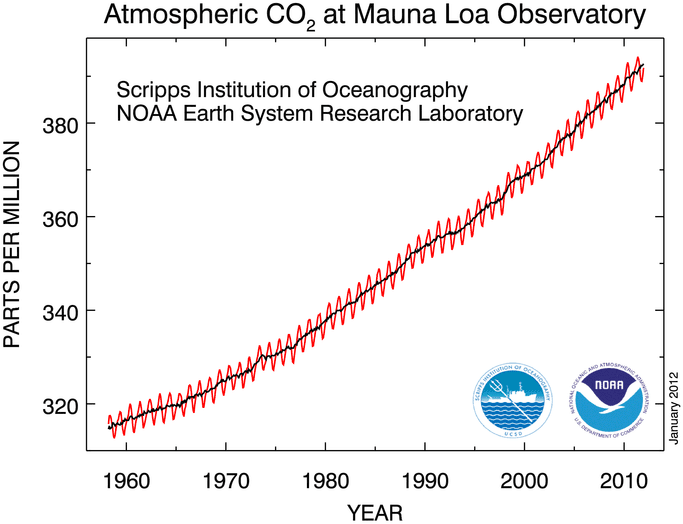
Keeling Curve: Click to view source page
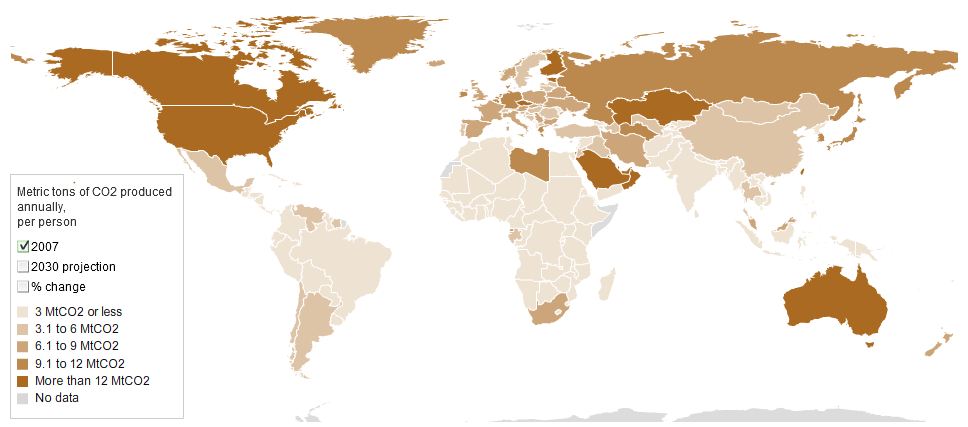
Click to view interactive National Public Radio map
data originally from the U.S. Energy Information Administration; Climate Analysis Indicators Tool (CAIT) Version 8.0. (Washington, DC: World Resources Institute, 2011)
Credit: Alyson Hurt, Kathleen Masterson and Andrew Prince / NPR
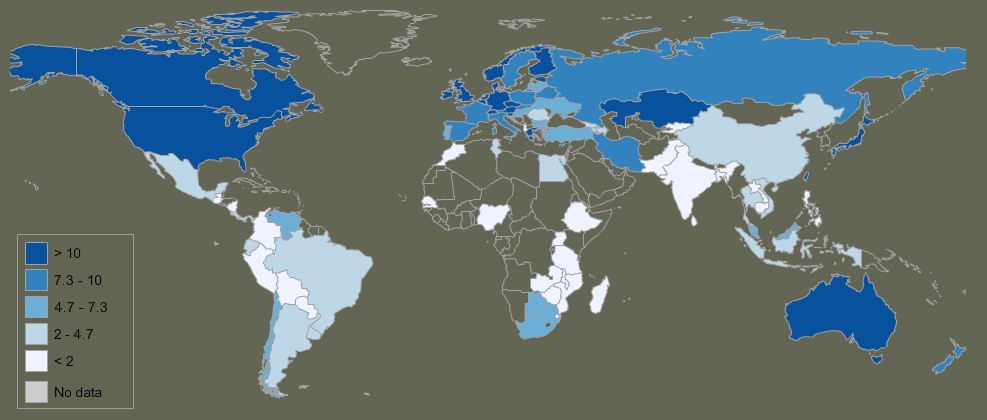
Click to view interactive Norwegian University Science & Technology map;
data originally from the Peters et al. (2011)
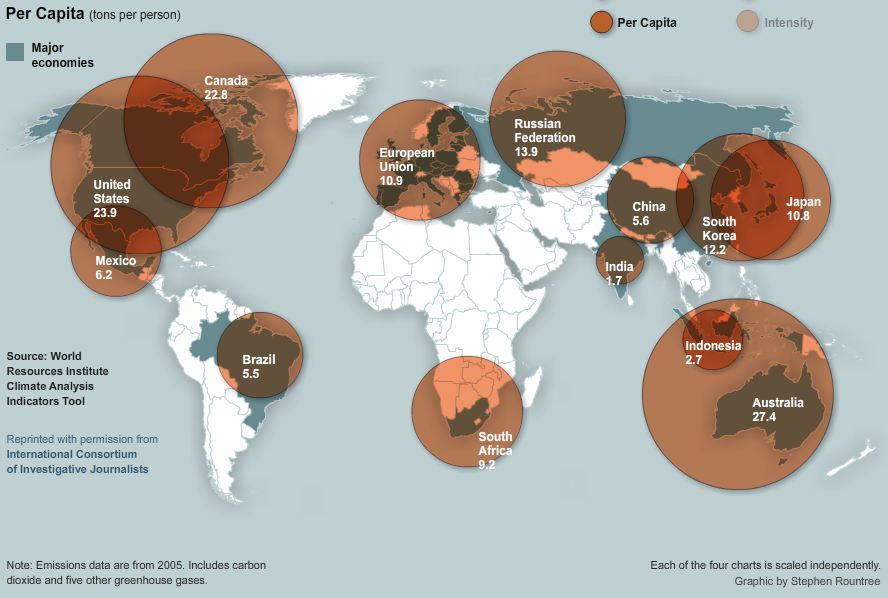
Click to view interactive National Geographic map;
data from the World Resources Institute graphic by S Rountree
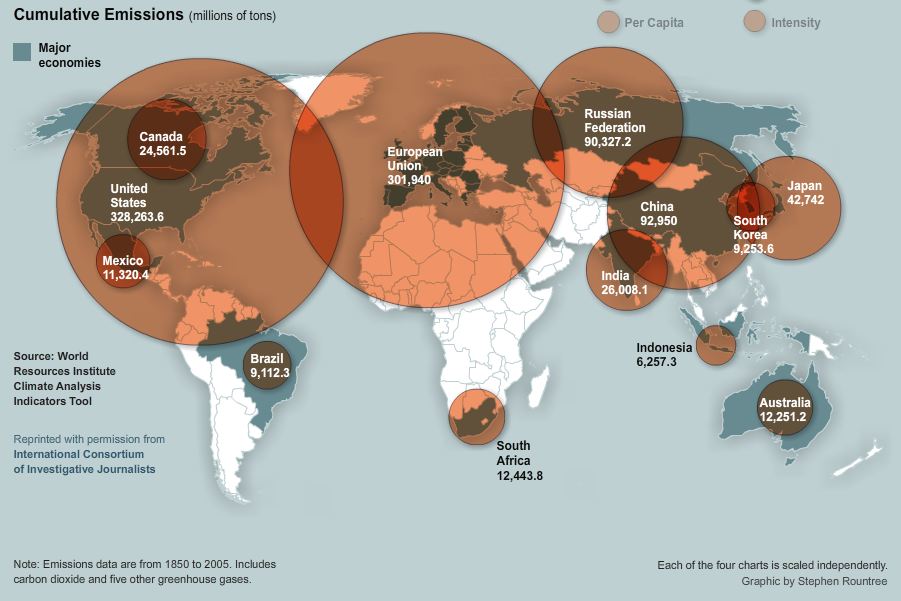
Click to view interactive National Geographic map;
data from the World Resources Institute graphic by S Rountree

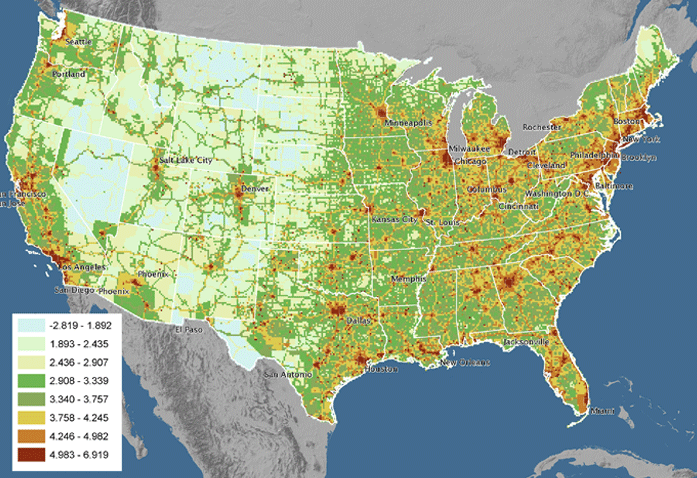
Click to view US map
data originally from the World Resources Institute
National geo Ed resource
National geo food comparison calc
foot pring map 1960-2050
Ecological_Footprint_Atlas_2010
Human Footprint Maps
Human Footprint Nasa 2
The Human Footprint National Journal
Human Footprint Nasa
Human Footprint Nasa 3
Human Footprint Nasa 5
Human Footprint Nasa 4
Human Footprint Nasa 4
Best Foot fwd Ecological footprint for UK
Eco Foot print calculator
Ecology FUnd Eco calculator for EU, US, and AUS
Sustainable Scale Project
Water footprint diagrams
crops
http://environment.nationalgeographic.com/environment/freshwater/global-water-footprint/
wf of nations
http://wwf.panda.org/about_our_earth/all_publications/living_planet_report/living_planet_report_graphics/water_footprint_interactive/
footprint graphics
http://www.waterfootprint.org/?page=files/InfoGraphics
http://www.waterfootprint.org/downloads/2009-GOODTransparancy.jpg
http://www.waterfootprint.org/downloads/2012-TheGuardian-VirtualWaterFlows.gif
http://www.waterfootprint.org/downloads/Poster-A3-WaterFootprint-of-Products.pdf
http://www.waterfootprint.org/downloads/2011-TNC-WaterFootprintPoster.jpg