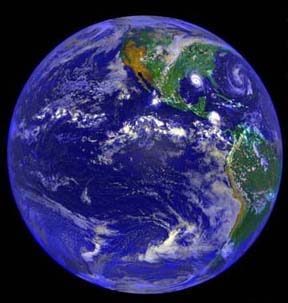
Close to 3/4 of the Earths surface is covered with water; yet fresh water scarcity is threatening both human populations and ecosystems world-wide.
(Click here to read more about the global water crisis.)
How can the inhabitants of a water covered world be in water stress?
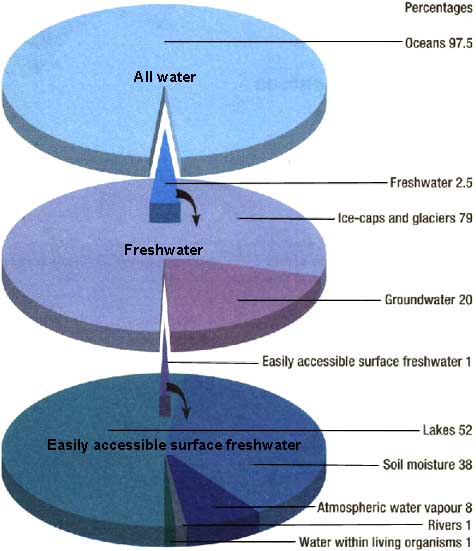
It is estimated that 97- 98% of Earths water lies in the great ocean basins. Thus salt can be considered the largest contaminant in the planetary drinking supply. Of the 2-3% of the earths water that is considered fresh (< .03% salt by weight) most is locked up in the polar ice caps. Easily accessible fresh surface water is estimated to be less than .1% of the planets overall water resources.
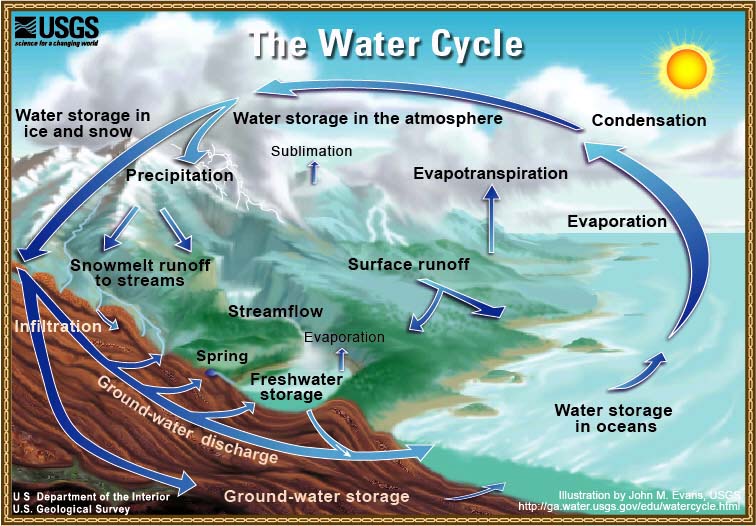
The movement of the world's water through different physical phases (i.e. solid, liquid, and gas) is referred to as the hydrodynamic cycle. Solar energy heats Earth's surface waters and drives evaporation. Evaporated water vapor rises, where it cools, and ultimately
condenses into clouds.
Clouds often move long distances via local air currents before loosing much of their water content through precipitation. This precipitation, may in turn recharge surface reservoirs and underground aquifers through infiltration.
One way to get a better sense of some of the different aspects of the earth's
hydrodynamic cycle
is to
look at different graphical depictions.
(press here for graphical tour).
Notice that different diagrams
emphasize the importance of different components of the worlds water system (i.e. solar heating, plant transpiration, surface geography, and subterranean water flow.)
Driven by seasonal variations in incident solar radiation, atmospheric and oceanic currents, and physical geography the water cycle distributes fresh water seasonally and unevenly around the globe. The animated terrestrial precipitation map featured below shows precipitation patterns averaged month by month from 1961 to 1990. Clearly visible is the latitudinal shift in precipitation over the course of an average year.
In 2015 NASA unveiled the following high spatial (10km x 10km)and temporal resolution (30 min.) animation of data gathered over the course of 2014. This map reveals much greater detail about the complexity of the patterns of actual precipitation rather than monthly averages.
satellite precipitation imagery from 2014.
High Resolution Global Precipitation Map from NASA (2014).
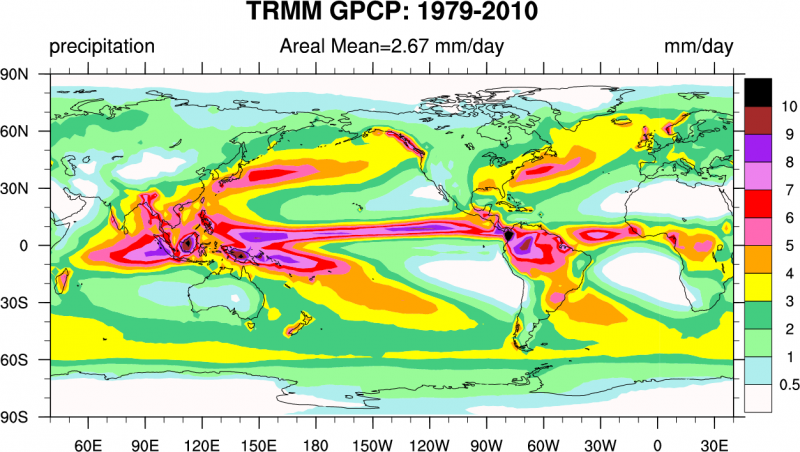
In general terms it is worth noting that the vast majority of rain falls in the tropics and in the ocean. This can be easily with precipitation data averaged over the course of a year. The
Global Precipitation Climatology Project (GPCP)
map below derived from 1988-2004 NASA data below reveals higher annual precipitation along the Coriolis driven, polewards aspect of the Pacific and Atlantic ocean currents.
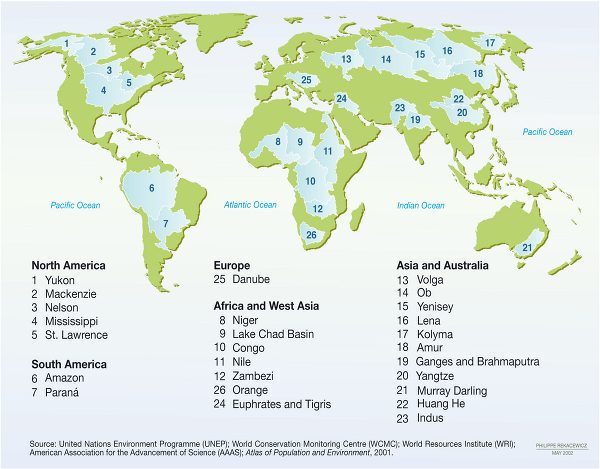
Much of the rain incident on the world's land masses is collected and channeled by river basins. The twenty-three largest river basins are illustrated in the UNEP map below. Water collected by river basins is channeled to the ocean, lakes, aquifers, directly tapped by human kind, absorbed by surrounding soil and water, or evaporates.
The World's Largest River Basins. Compliments of
(UNEP).
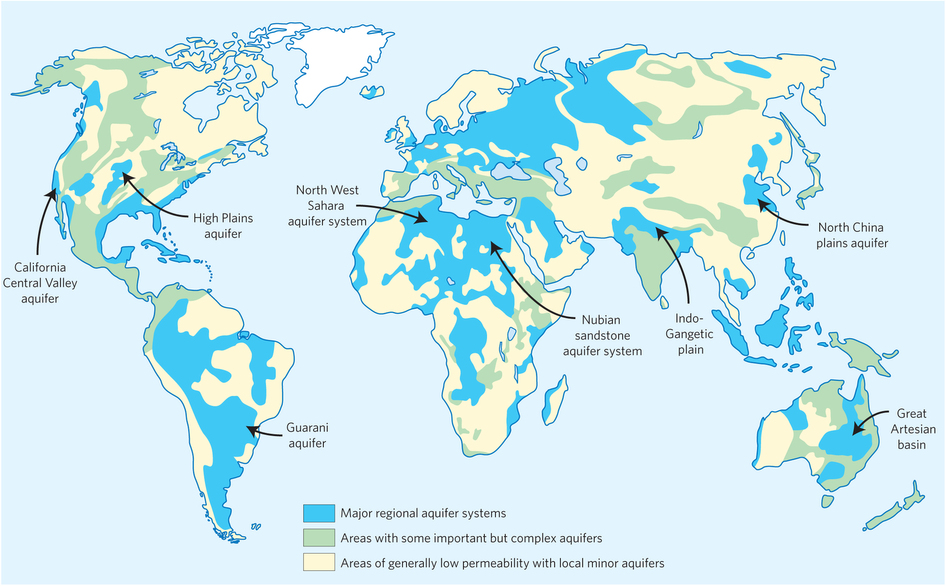
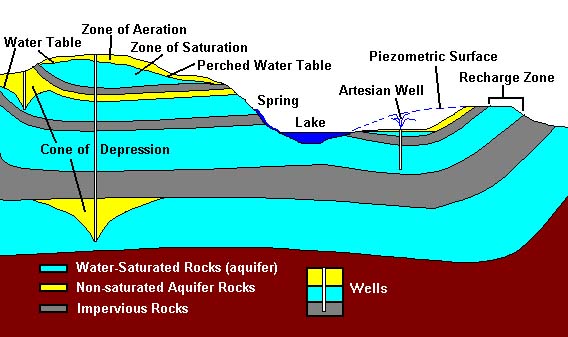
Aquifers are subterranean volumes of creviced rock that have the capacity to hold large amounts of water (see the USGS figure below). Some aquifers are continually recharged by precipitation and inflitration of water from the surface.
Estimates suggest that 20% of all accessible freshwater is found as groundwater in aquifers. However the ability of earth materials to store or transmit water varies significantly. Thus, like oceans, precipitation patterns, and river basins, aquifers are not distributed evenly across the surface of the planet.
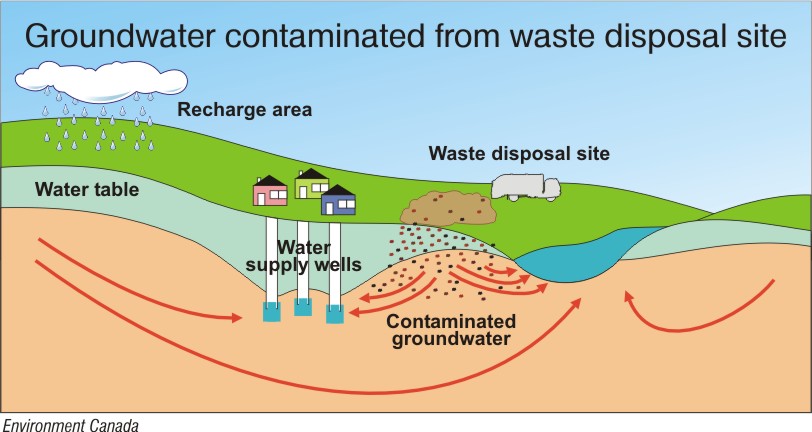
Because of the limited porosity of many rock types and the convoluted structure of the network of crevices that make up an aquifer, subterranean water flows at very slow speeds. Although water may have chemicals leech into it under ground the
tightly nit rock structures can also act as filters provided that the path length is sufficiently long. Thus many wells and springs provide fresh water largely untainted from biological pathogens and chemical contaminants.
The underground geological features that define
aquifer basins
and
properties can be complex. In the following diagram, notice how
the aquifers in this region are depicted as being stacked with layers
of relatively impermeable rock between them.
The illustration above also depicts several wells. Wells can draw down water in the aquifer nearby. This can lead to a cone of depression forming in the water table as rock near the well head is depleted of water (see animation of well draw down below.) A local depression in the water level may not only lead to a well running dry but can also deprive local vegetation and animal life of water resources.
Cones of depression represent a loss of hydrostatic pressure in the volume around the well head. Thus a cone of depression not only lowers the effective water table for a given well but the loss of hydrostatic pressure can leave the aquifer open to intrusion by contaminants, result in land subsidence, or the formation of sinkholes.
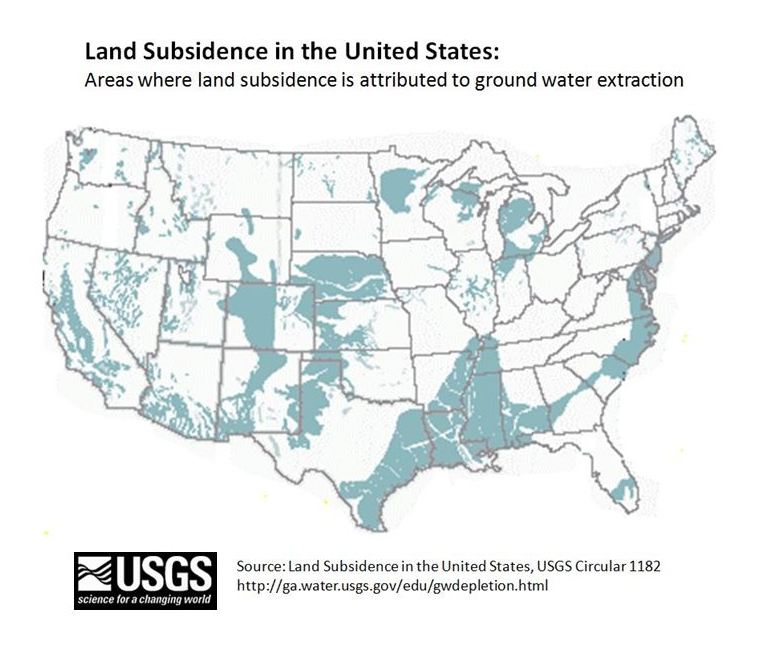
A global map of land subsidence is
currently in progress however the USGS has published the following map of land subsidence in the continental US.
This page provides a basic introduction to relevant water science.
Most of the graphics used for this page are selected from educational and scientific websites. In all cases the graphic links to the original website. We do not guarantee the accuracy of these sites, but many are of high quality and we encourage the interested reader to read them thoroughly.