Graphical Learning Modules
The lack of core scientific competencies is a fundamental challenge for sustainable development in both the developing and the developed world. Educational outreach is a primary to the diffusion of sustainable lifestyles and technologies. The graphical learning modules featured here are one more tool that can be used by internet audiences or in computer accessible educational forums as ways for people to discover and explore critical environmental health challenges and solutions. These modules range from simple images and powerpoint based slide shows to animated .gifs and interactive graphs and animations. Much of the data conveyed is presented courtesy of the USGS, NASA, EPA, NOAA, WHO and affiliated scientists and researchers. Citations and links to original sources are included in all cases. Enjoy and share these modules (and please link to this site)!
Appropriate Technology | ||
|
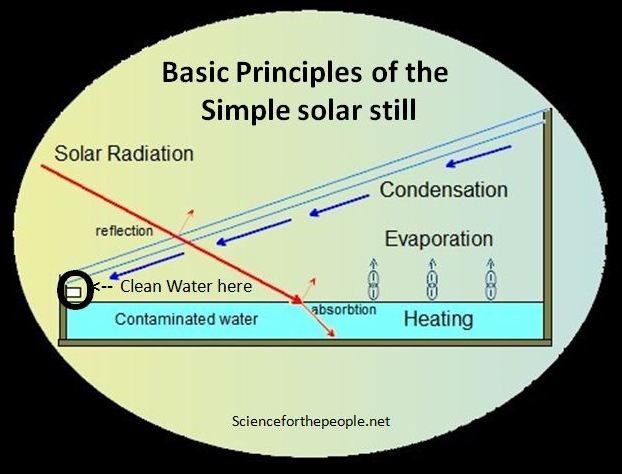
Solar Stills Solar Distillation Process (animation) Solar Distiller Energy Flux (image) | |
Environmental Science | ||

|
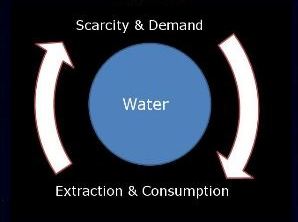
Water The Aral Sea from 1977 to 2008 (animation) Water Table Levels Drop Near Wells (animation) Water Table Levels Drop Near Wells (image) The Water Footprint of Food items Scarcity Extraction Depletion Dynamic The SED Dynamic (interactive) Oil SED Dynamic (animation) Water SED Dynamic (animation) Ecological Nexus Water-Energy Nexus (interactive) Water-Energy-Climate Nexus (interactive) Global Trends Global Trends Graph (interactive) | |
|
| ||